
The nanoFAB is pleased to announce that advanced Small-Angle X-ray Scattering (SAXS), Grazing-Incidence Small-Angle and Wide-Angle X-ray Scattering (GI-SAXS/WAXS) techniques are fully commissioned on the Bruker D8 DISCOVER Plus X-Ray Diffractometer and now open for user training.
SAXS utilizes small-angle x-ray scattering to quantify nano-scale density differences in a sample, which enables characterization of nanostructures in terms of the averaged particle sizes, shapes, distribution, pore sizes, characteristic distances of partially ordered materials, and much more. This is achieved by analyzing the elastic scattering behavior of X-rays when traveling through the material, recording their scattering at small angles (typically 0.1 – 10°).
The materials for SAXS analysis can be solid or liquid and they can contain solid, liquid or gaseous domains (so-called particles) of the same or another material in any combination. Not only particles, but also the structure of ordered systems like lamellas, and fractal-like materials can be studied. For thin films supported on solid substrates (such as glass or Si), derivatives of SAXS, namely GI-SAXS/WAXS can be used to characterize ordered structure/alignment within the films relative to the substrate surface, particularly molecular alignment/arrangement of polymer films. These methods are accurate, non-destructive and usually require a minimum of sample preparation. Applications are very broad, including colloids of all types, metals, cement, oil, polymers, plastics, proteins, foods and pharmaceuticals.
If you are interested in the SAXS, GI-SAXS/WAXS analysis, please submit a request (training or sample type) with sample details on LMACS. Our XRD team (Drs. Xuehai Tan and Nas Yousefi) will follow up and arrange sample analysis and training. If you have any questions, please feel free to contact Peng Li (Peng.Li@ualberta.ca) – the Characterization Group Manager.
Application Examples
- Sample: 20 nm Au NPs
- Sample preparation: in water (capillary tube)
- Analysis: SAXS
- Application: Size distribution analysis
Among several techniques to measure particle size, SAXS provides accurate, reliable and high throughput analysis with simple sample preparation. While TEM imaging based analysis provides direct visualization with very high spatial resolution, it requires proper sample preparation (well dispersed particles) and the result accuracy relies on the quality of particle intensity thresholding. SAXS analysis is less dependent on sample preparation and probes a large volume of samples, providing the most statistically relevant results.
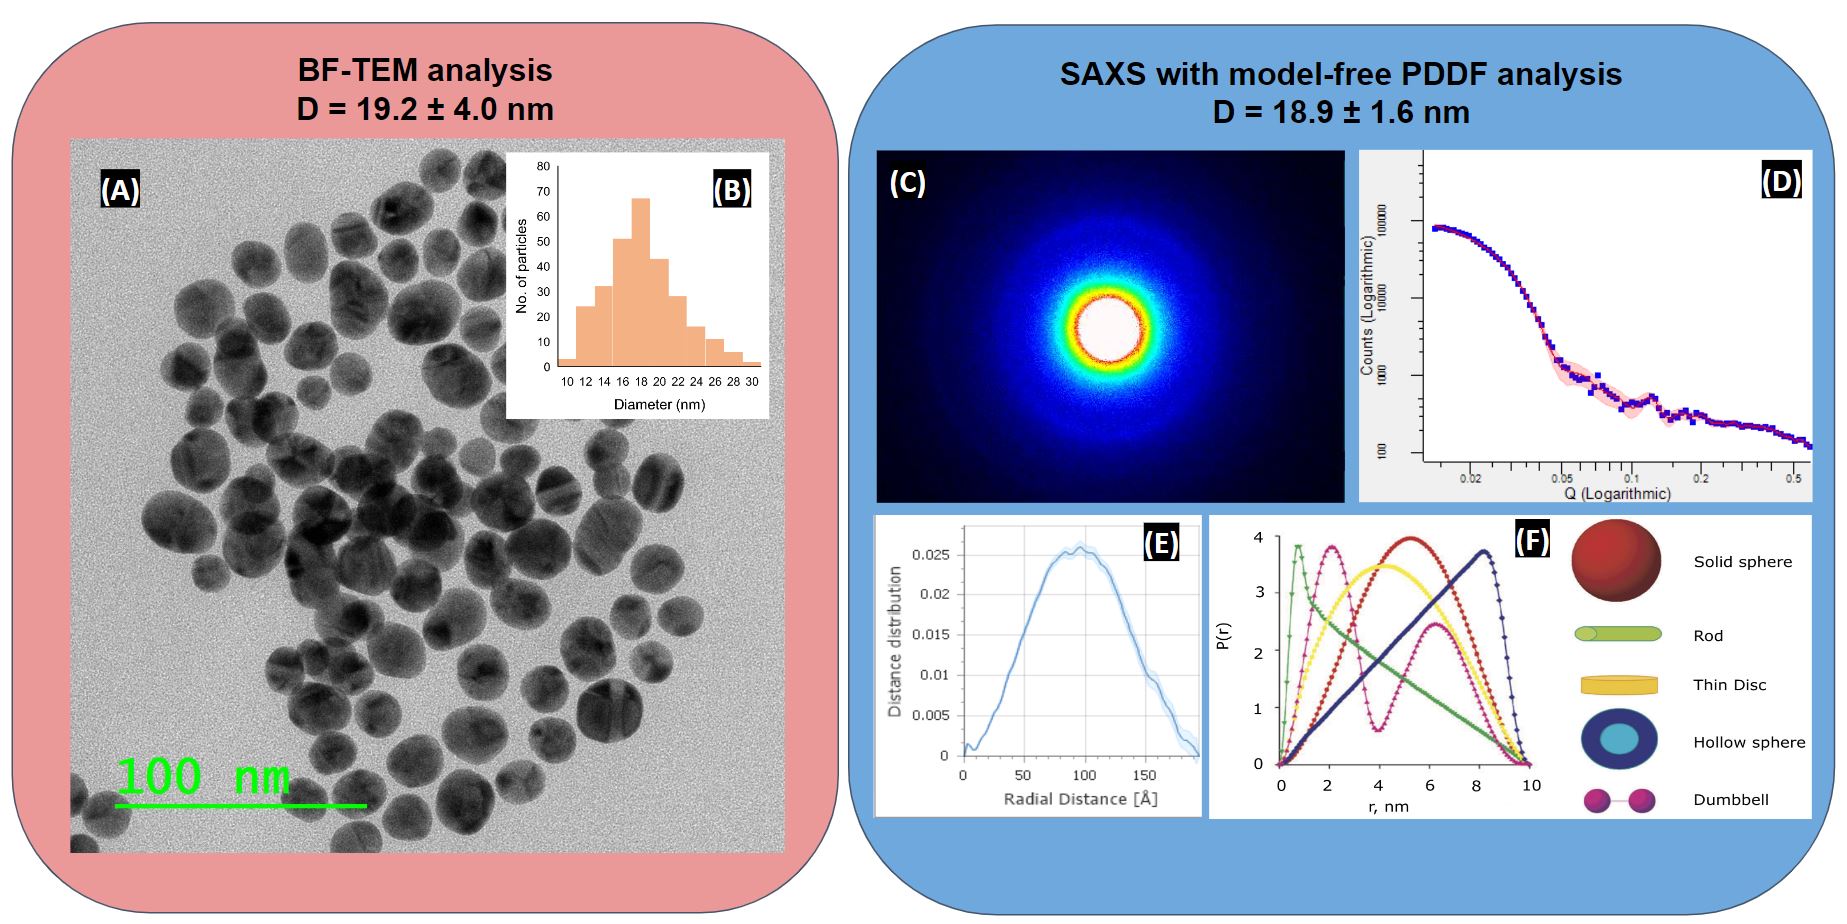
Figure 1: (A) Bright-Field TEM image and (B) measured size distribution of the Au nanoparticles, diameter = 19.2 ± 4.0 nm. (C) 2D SAXS data measured with an evacuated flight tube (EFT) filled with vacuum. (D, E) SAXS data integrated into 1D and background subtraction: A model-free analysis based on Pair Distance Distribution Function (PDDF). The obtained result is indicative of an overall spherical particle shape with approximated diameter of 18.9 nm. (F) PDDF P(r) functions for geometric bodies, adapted from DOI 10.1088/0034-4885/66/10/R05
- Sample: 3 nm Si QDs
- Sample preparation: in toluene (capillary tube)
- Analysis: SAXS
- Application: Size distribution analysis
- Sample Courtesy: Chuyi Ni and Prof. Jon Veinot, Department of Chemistry, University of Alberta
TEM imaging analysis can be very challenging to characterize particle size when particles are difficult to disperse and/or the particles give poor contrast, such as light-element quantum dots (QDs), e.g., Si or carbon QDs. SAXS can provide reliable size and shape structure determination, empowered by several data analysis / modelling methods and further advances in instrumentation.
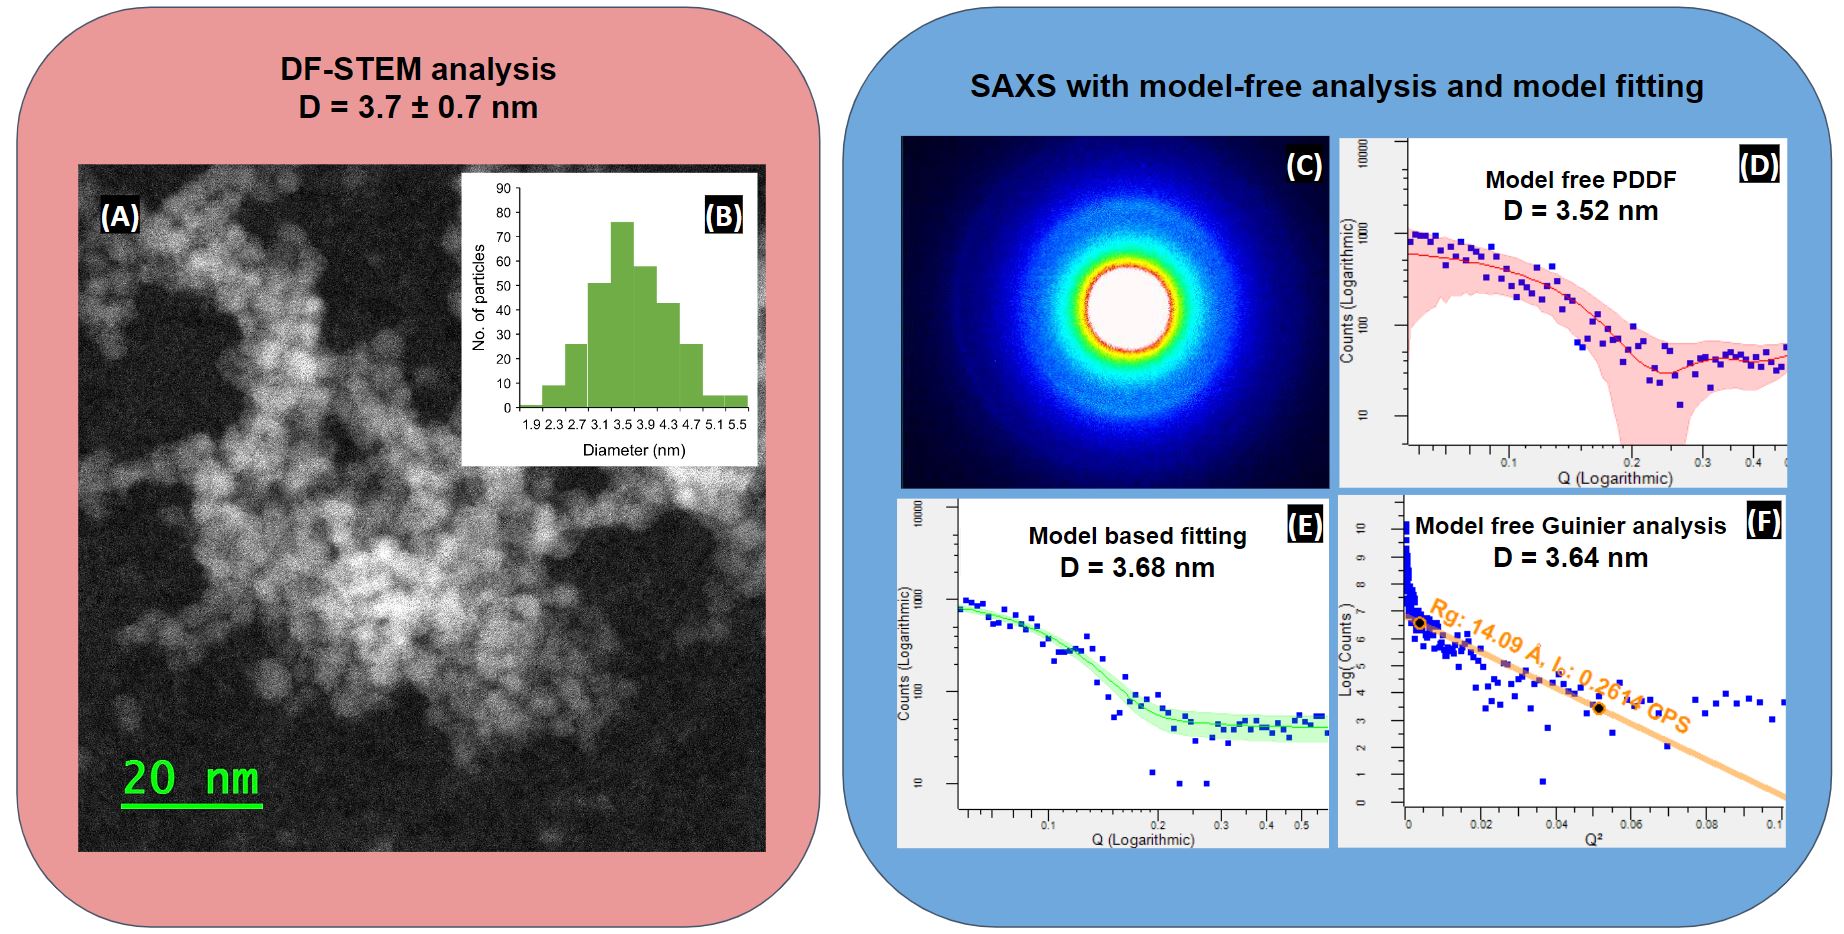
Figure 2: (A) Dark-Field STEM image and (B) measured size distribution of Si QDs, diameter = 3.7 ± 0.7 nm. (C) 2D SAXS data measured with an evacuated flight tube (ETF) filled with vacuum. SAXS analysis results with model free and model fitting: (D) Model free PDDF, diameter = 3.52 nm; (E) a model-based fitting assuming polydisperse spheres with Schultz size distribution and no interaction, diameter = 3.68 nm; (F) model-free Guinier analysis, diameter = 3.64 nm.
- Sample: textured PVDF film
- Sample preparation: Freestanding film
- Analysis: SAXS
- Application: Internal periodical structures and orientation
- Sample Courtesy: Amanuel Abay and Prof. Anastasia Elias, Faculty of Engineering, University of Alberta
SAXS is useful not only for characterizing the size and shape of particles, but also for measuring structural information of partially or completely disordered systems. In the following example, SAXS analysis is utilized to study the internal repeating structure of a free-standing PVDF film.
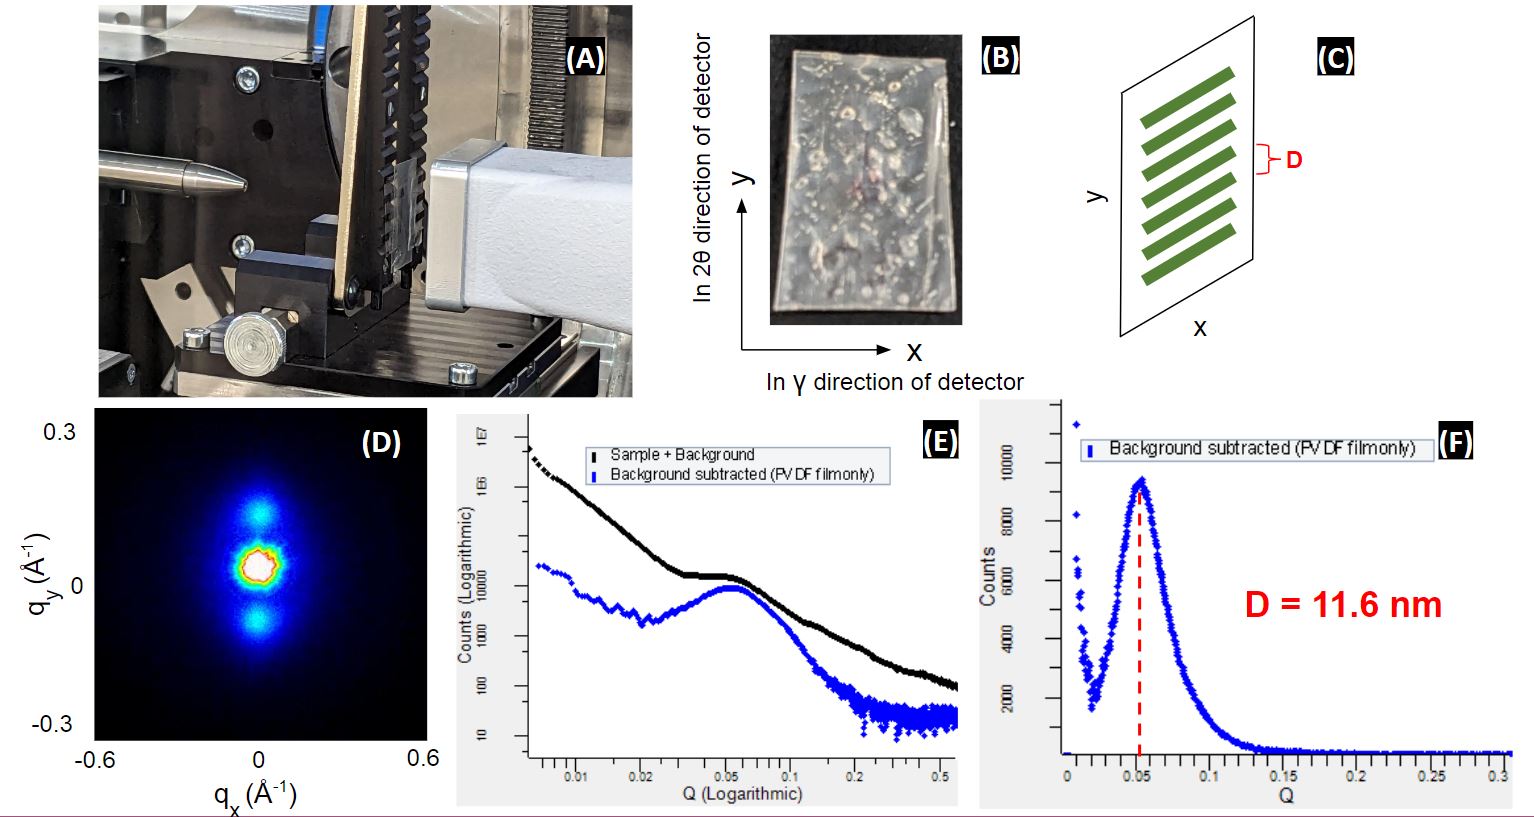
Figure 3: (A) a photo of the SAXS setup, including X-ray collimator, the vertically mounted free-standing PVDF film, and the evacuated flight tube (EFT) that is attached to the 2D detector. (B) The orientation of the sample with respect to the 2theta and gamma directions of the 2D detector. (C) Illustration of the internal lamella orientation confirmed by the SAXS analysis. (D) 2D SAXS data marked with q values in both 2𝛉 and 𝞬 directions. (E) SAXS data integrated into 1D and background subtraction. (F) The measured q value suggests a repeated distance of 11.6 nm for the internal lamella.
- Sample: Organic Photovoltaic (OPV) films (30 nm PEDOT + 250 nm P3HT:PCBM)
- Sample preparation: Spin-coated on ITO-coated glass substrate
- Analysis: GI-SAXS
- Application: Internal periodical structures and orientation
- Sample Courtesy: Prof. Jillian Buriak, Department of Chemistry, University of Alberta
GI-SAXS is particularly useful to analyze domain size, interplanar spacings and orientation of small molecule/polymer thin films for photovoltaics, block copolymer thin films and inorganic/metal thin films for batteries. GI-SAXS analysis of an organic Photovoltaic film (P3HT:PCBM) measured an interplanar spacing d = 1.61 nm and their 2D distribution (both in-plane 2𝛉 and out-of-plan β).
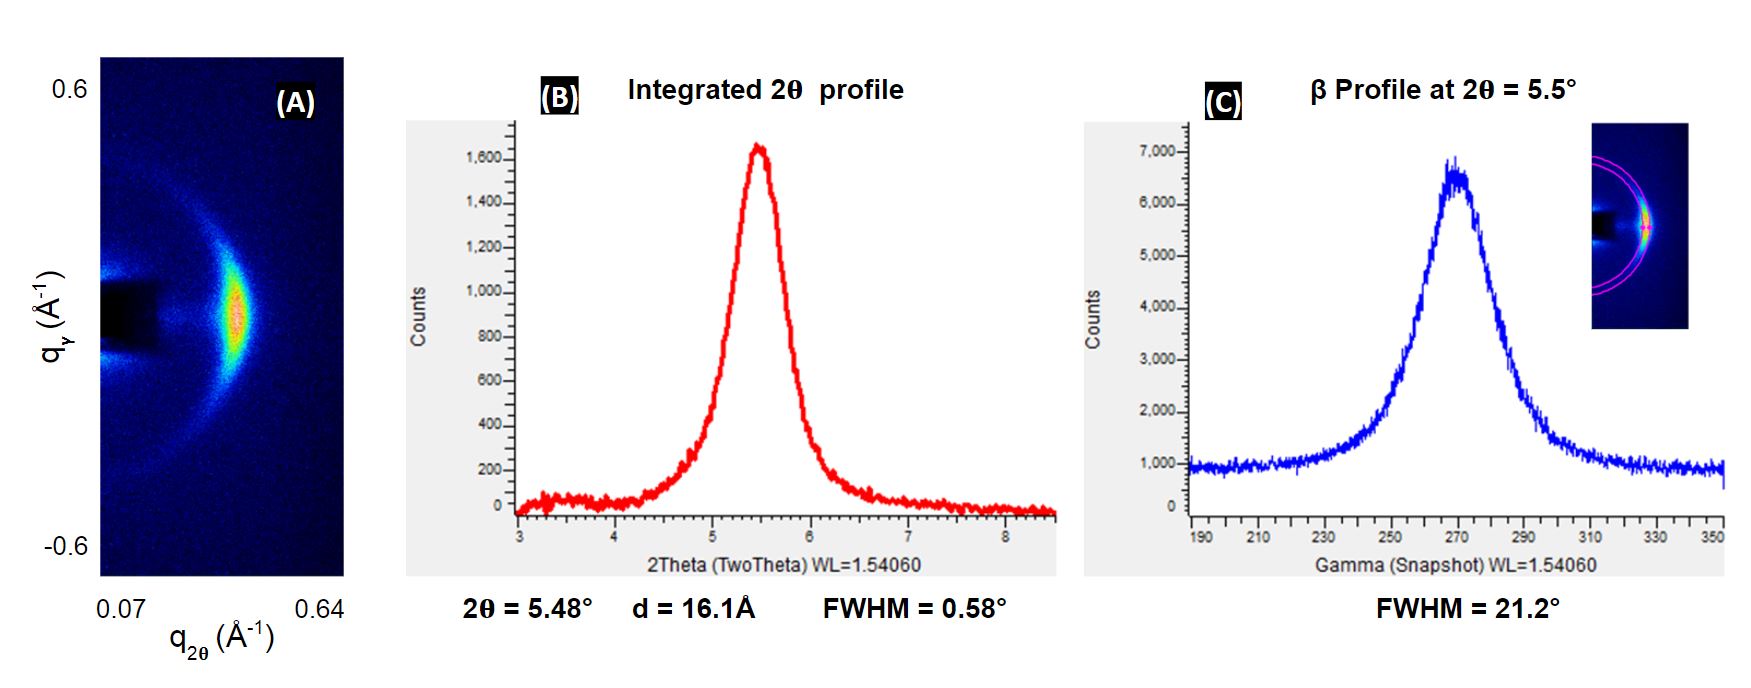
Figure 4: (A) 2D GI-SAXS data marked with q values in both 2𝛉 and gamma directions; (B) Integrated profile in 2𝛉 direction and (C) Integrated profile in β direction.
- Sample: PBTTT film (30 nm)
- Sample preparation: spin-coated on ITO-coated glass substrate
- Analysis: GI-WAXS
- Application: Internal periodical structures and orientation
- Sample Courtesy: Prof. Loren Kaake, Department of Chemistry, Simon Fraser University
Semiconducting polymers play an important role in advancing the field of printed and mechanically flexible electronics, such as flat panel displays and photovoltaic cells. Thin film transistors with thiophene-based polymer layers have demonstrated good field-effect carrier mobilities that are considered highly valuable across various applications. It is widely recognized that achieving high carrier mobility in these materials hinges on the precise molecular ordering, as charge movement depends on effective intermolecular electronic coupling. While the spacing of the molecular ordering and crystalline domains is too small for GI-SAXS, GI-WAXS provides an effective analysis.
As shown in the figures below, typical GI-WAXS setups on the Bruker D8D plus (0.1 mm slit and a 0.3 mm Goebel mirror collimator, 0.17° incidence angle, and 145 mm sample-to-detector distance) effectively confirms the edge-on orientation of the polymer lamellas in a 30 nm PBTTT film on glass.
Compared to the results (available here) obtained from the Synchrotron Hard X-ray MicroAnalysis (HXMA) beamline (at the Canadian Light Source), the GI-WAXS analysis on the Bruker D8D plus provides equally informative results, but more accessible to general users.
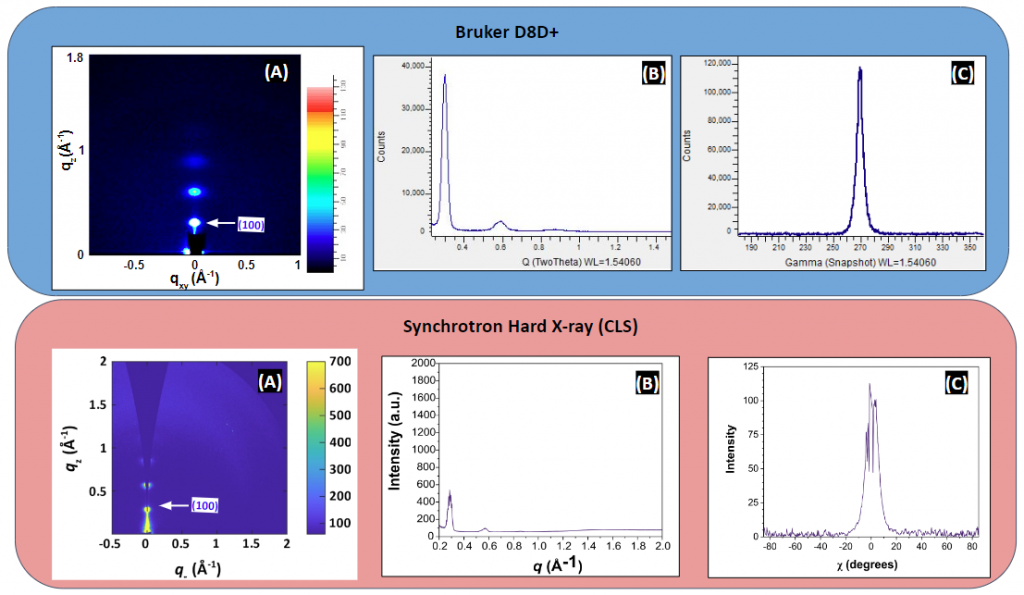
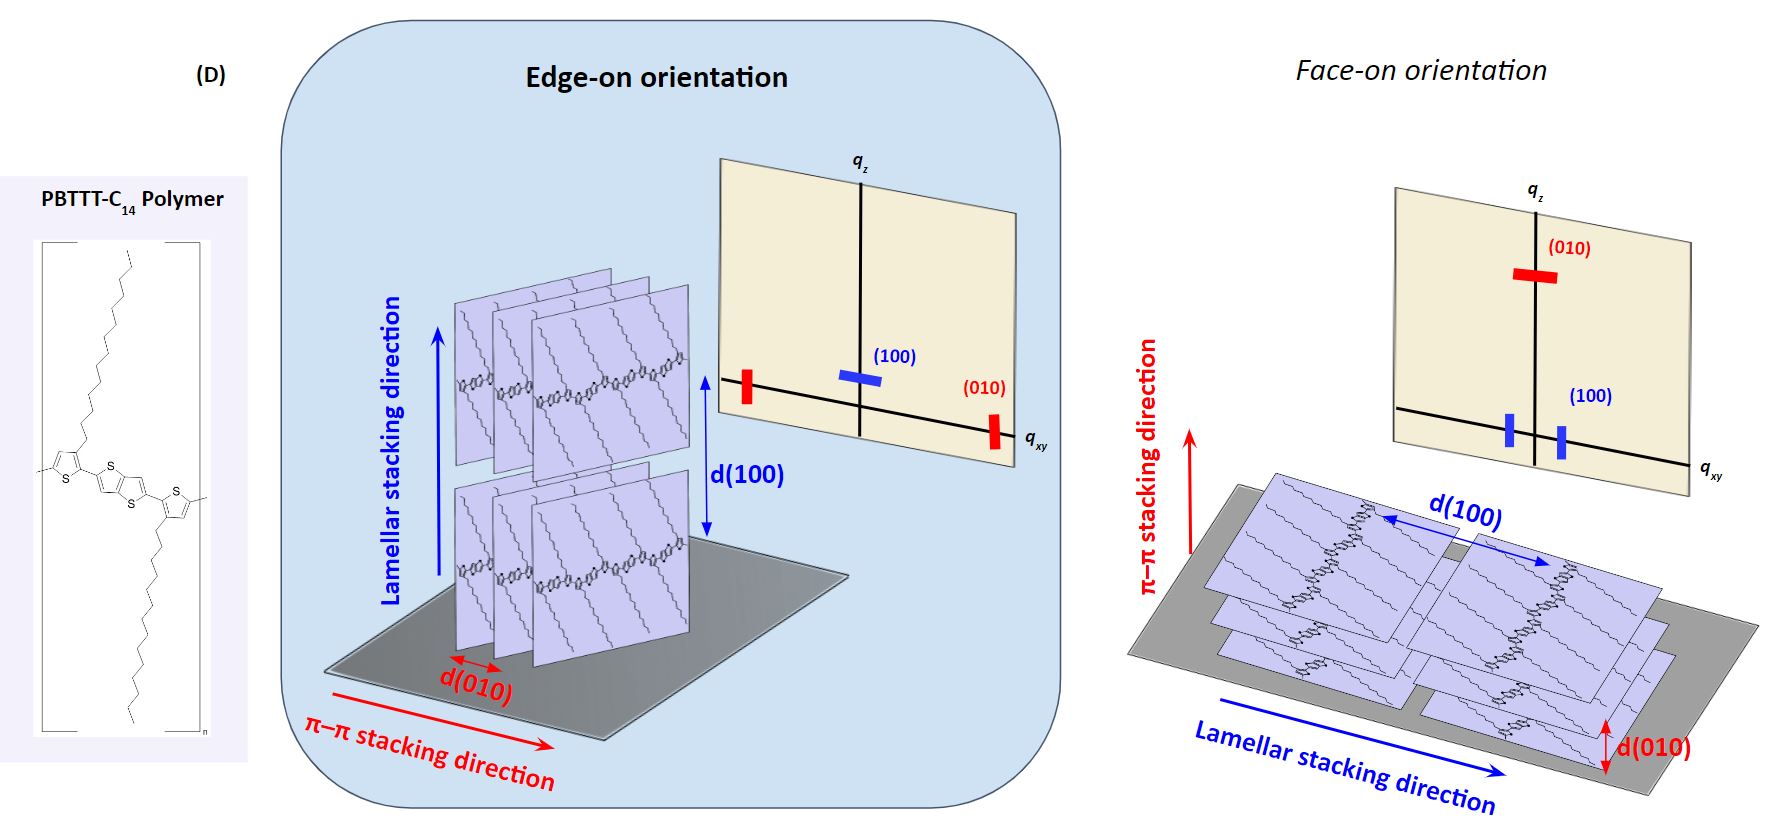
Figure 5: GI-WAXS results of PBTTT thin films measured on the Bruker D8D + and the Synchrotron Hard X-ray MicroAnalysis (HXMA) beamline of the Canadian Light Source. (A) Two-dimensional WAXS scattering data (B) 1D profile of the scattering intensity. (C) Azimuthal dependence of the scattering intensity. (D) The molecular structure of PBTTT and the schematic depicting PBTTT different molecular alignment within thin layers relative to the substrate surface: Edge-On and Face-On orientations. The arrangement of molecules within the cell is primarily qualitative and is not intended to provide a quantitative representation of the precise molecular packing specifics.